健康管理
体調記録
通院などの記録
基本情報の確認
- 体重
- 視力
- 握力
運動習慣などの記録
- 一週間に3回、30分の運動
- 筋トレ
- ストレッチの習慣化
- 良質な睡眠の習慣化
- 食べ物の良い習慣化
- 姿勢
| 月 | 1 | 2 | 3 | 4 | 5 | 6 | 7 | 8 | 9 | 1o | 11 | 12 |
|---|---|---|---|---|---|---|---|---|---|---|---|---|
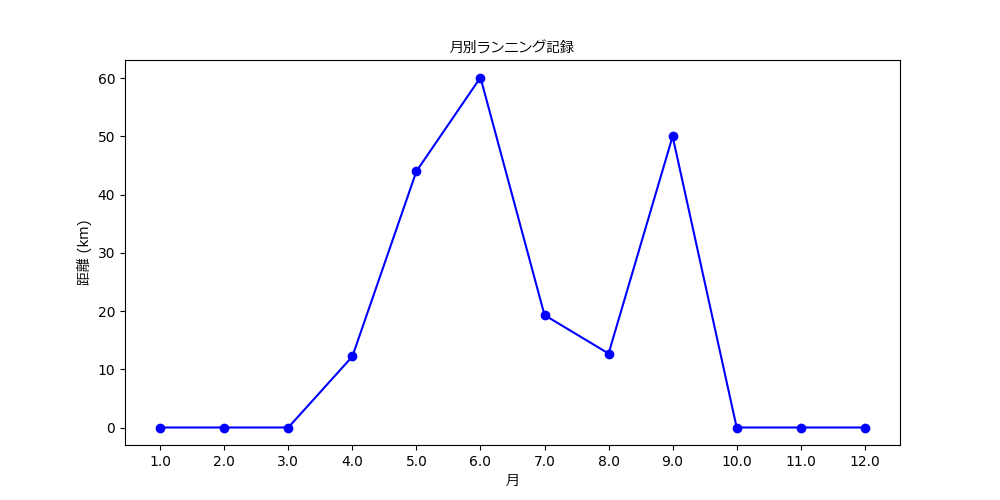
| ランニング | - | - | - | 12.2 | 44 | 60.1 | 19.3 | 12.7 | ||||
| 睡眠 | - | - | - | 1 | 44 | 60.1 | 19.3 | 12.7 | ||||
| 睡眠 | - | - | - | 1 | 44 | 60.1 | 19.3 | 12.7 | ||||
Pythonコードを表示
import matplotlib.pyplot as plt
import matplotlib.font_manager as fm

# 月とランニング距離のデータ
months = ['1', '2', '3', '4', '5', '6', '7', '8', '9', '10', '11', '12']
running_data = [0, 0, 0, 12.2, 44, 60.1, 19.3, 12.7, 0, 0, 0, 0]


# 日本語フォントのパスを取得(Windowsの例)
font_path = "C:/Windows/Fonts/meiryo.ttc"  # または "msgothic.ttc"

# フォントプロパティを設定
jp_font = fm.FontProperties(fname=font_path)

# グラフのラベルなどに日本語フォントを適用
plt.title("月別ランニング記録", fontproperties=jp_font)
plt.xlabel("月", fontproperties=jp_font)
plt.ylabel("距離 (km)", fontproperties=jp_font)

# グラフ描画(Noneは自動で欠損扱いされる)
plt.figure(figsize=(10, 5))
plt.plot(months, running_data, marker='o', linestyle='-', color='blue', label='ランニング距離 (km)')


# 保存(必要なら)
plt.savefig('running_record.png')

# 表示
plt.show()
▶︎
all
running...